Automated Financial Reporting
Replaced a 3-hour manual weekly financial report with a fully automated pipeline delivering board-ready financials to the exec team every Monday at 8am.

The Challenge
A private equity-backed company's finance team spent every Sunday evening and Monday morning building the weekly board report — pulling data from 6 sources, consolidating in Excel, formatting charts, writing commentary, and emailing a 40-slide deck. The process was error-prone, stressful, and consumed hours that should have been spent on analysis.
What We Built
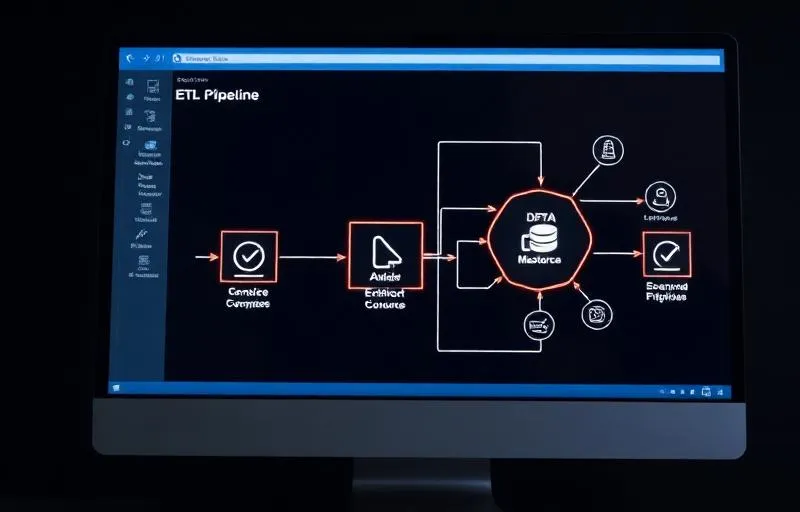
We built a Python-based data pipeline that extracts financial data from all 6 sources on Sunday night, consolidates into a master model in Excel format, and triggers a Power BI refresh. A Python script then generates the executive commentary by comparing this week's actuals vs budget vs prior week. The final PDF is automatically emailed to the board distribution list at 8am Monday via SharePoint automation.
How It Works
The finance team's Sunday ritual had become a running joke — and a genuine burnout risk. The CFO described spending 3–4 hours every Sunday evening pulling data, only to repeat the process Monday morning when the ERP had fresher numbers. The board expected the report by 9am Monday; on a bad week it arrived at 11.
We mapped every data source: the main ERP (for actuals), the budgeting tool (for variances), two bank feeds (for cash), the HR system (for headcount), and a CRM export (for pipeline). Each had a different export format, schedule, and level of automation.
Python scripts run at 5am Monday via a scheduled task on the client's server. They pull data from each source via API or SFTP, validate row counts and key metric ranges, transform to a standardised schema, and load into the master Excel model — which is locked to prevent accidental edits.
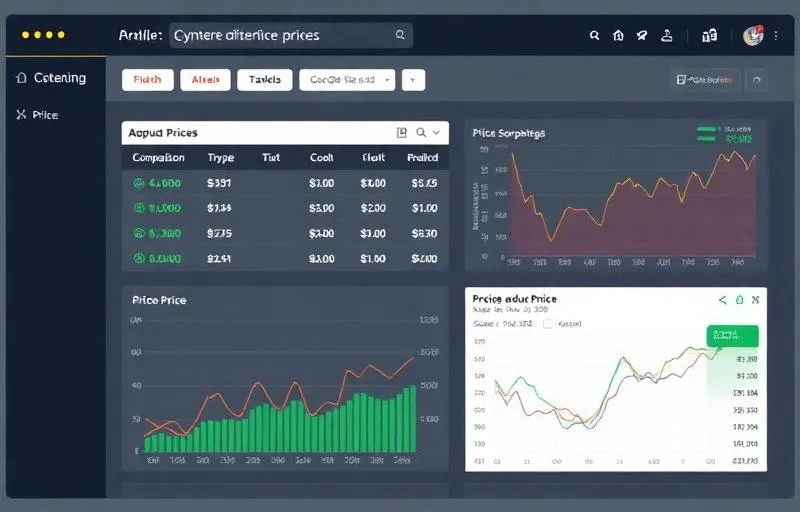
Power BI connects to the master model via SharePoint and refreshes automatically. The Python commentary generator calculates week-on-week and vs-budget variances for the 12 key KPIs and writes templated commentary ('Revenue of £2.1M is 4% above budget, driven by...'), which a human can edit before distribution.
The report now arrives in the board distribution list at 8:00am every Monday without any human involvement. The finance team uses Monday mornings — previously their most stressful time — for actual analysis. On-time delivery went from 70% to 100%.